
We are wrapping up 2022! Let’s take a look at market data from the previous 5 years.
Graph: Number of Active Listings
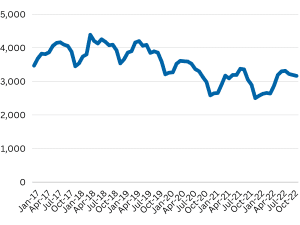
Note
If history repeats itself, we may see a slight seasonal dip in active listings. This is normal and healthy! It will make for new opportunities for buyers and sellers alike.
Graph: Number of Sold Listings
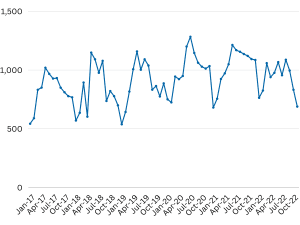
Note
The number of sold listings per month follows a similar, yet still healthy, up-and-down lifecycle.
Graph: Average Price / Square Foot
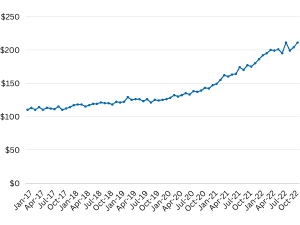
Note
Prices have continued to trend upward. However, economic, environmental, and other factors could have an impact on the future of home prices as well. Keep an eye on changing interest rates and area growth.